See the previous chapter…
- Course overview: goals and introduction
- Positions: latitude, longitude, nautical mile, scale, knots
- Nautical chart: coordinates, positions, courses, chart symbols, projections
- Compass: variation, deviation, true • magnetic • compass courses
- Plotting and piloting: LOPs, (running) fix, dead reckoning, leeway, CTS, CTW, COG
- Advanced piloting: double angle on the bow • four point • special angle fix, distance of horizon, dipping range, vertical sextant angle, radians, estimation of distances
- Astronomical origin of tides: diurnal, semi-diurnal, sysygy, spring, neap, axial tilt Earth, apsidal • nodal precession, declination Moon and Sun, elliptical orbits, lunar nodes
- Tides: tidal height prediction, chart datums, tidal curves, secondary ports
- Tidal streams and currents: diamonds, Course to Steer, Estimated Position
- Aids to navigation: buoys, leading lights, ranges, characteristics, visibility
- Lights and shapes: vessels sailing, anchoring, towing, fishing, NUC, RAM, dredging
2 – Nautical charts
Chart projections
Before working with electronic charts (C-MAP, Garmin, BA) it is essential to understand and work with paper charts. Both forms are 2-dimensional representations of a 3-dimensional world which will result in various distortions.
The alias of Gerard de Kremer,
Antwerpen 1512 – 1594.
However, as long as two requirements are met we can use the 2-dimensional image for navigational purposes:
- The angles between three objects in the chart should be the same as the angles between the real objects which they represent.
- A straight course should appear as a straight line in the chart.
To fulfil these demands a nautical chart requires parallels and meridians that are both straight and parallel.
Moreover, the meridians will need to be perpendicular to the parallels.
Mercator projection
A well known method to create such a chart is named after Gerard Mercator Kremer – a Flemish scholar who studied in 's Hertogenbosch (the Netherlands) and Leuven (now Belgium) and who invented his famous projection in 1569.
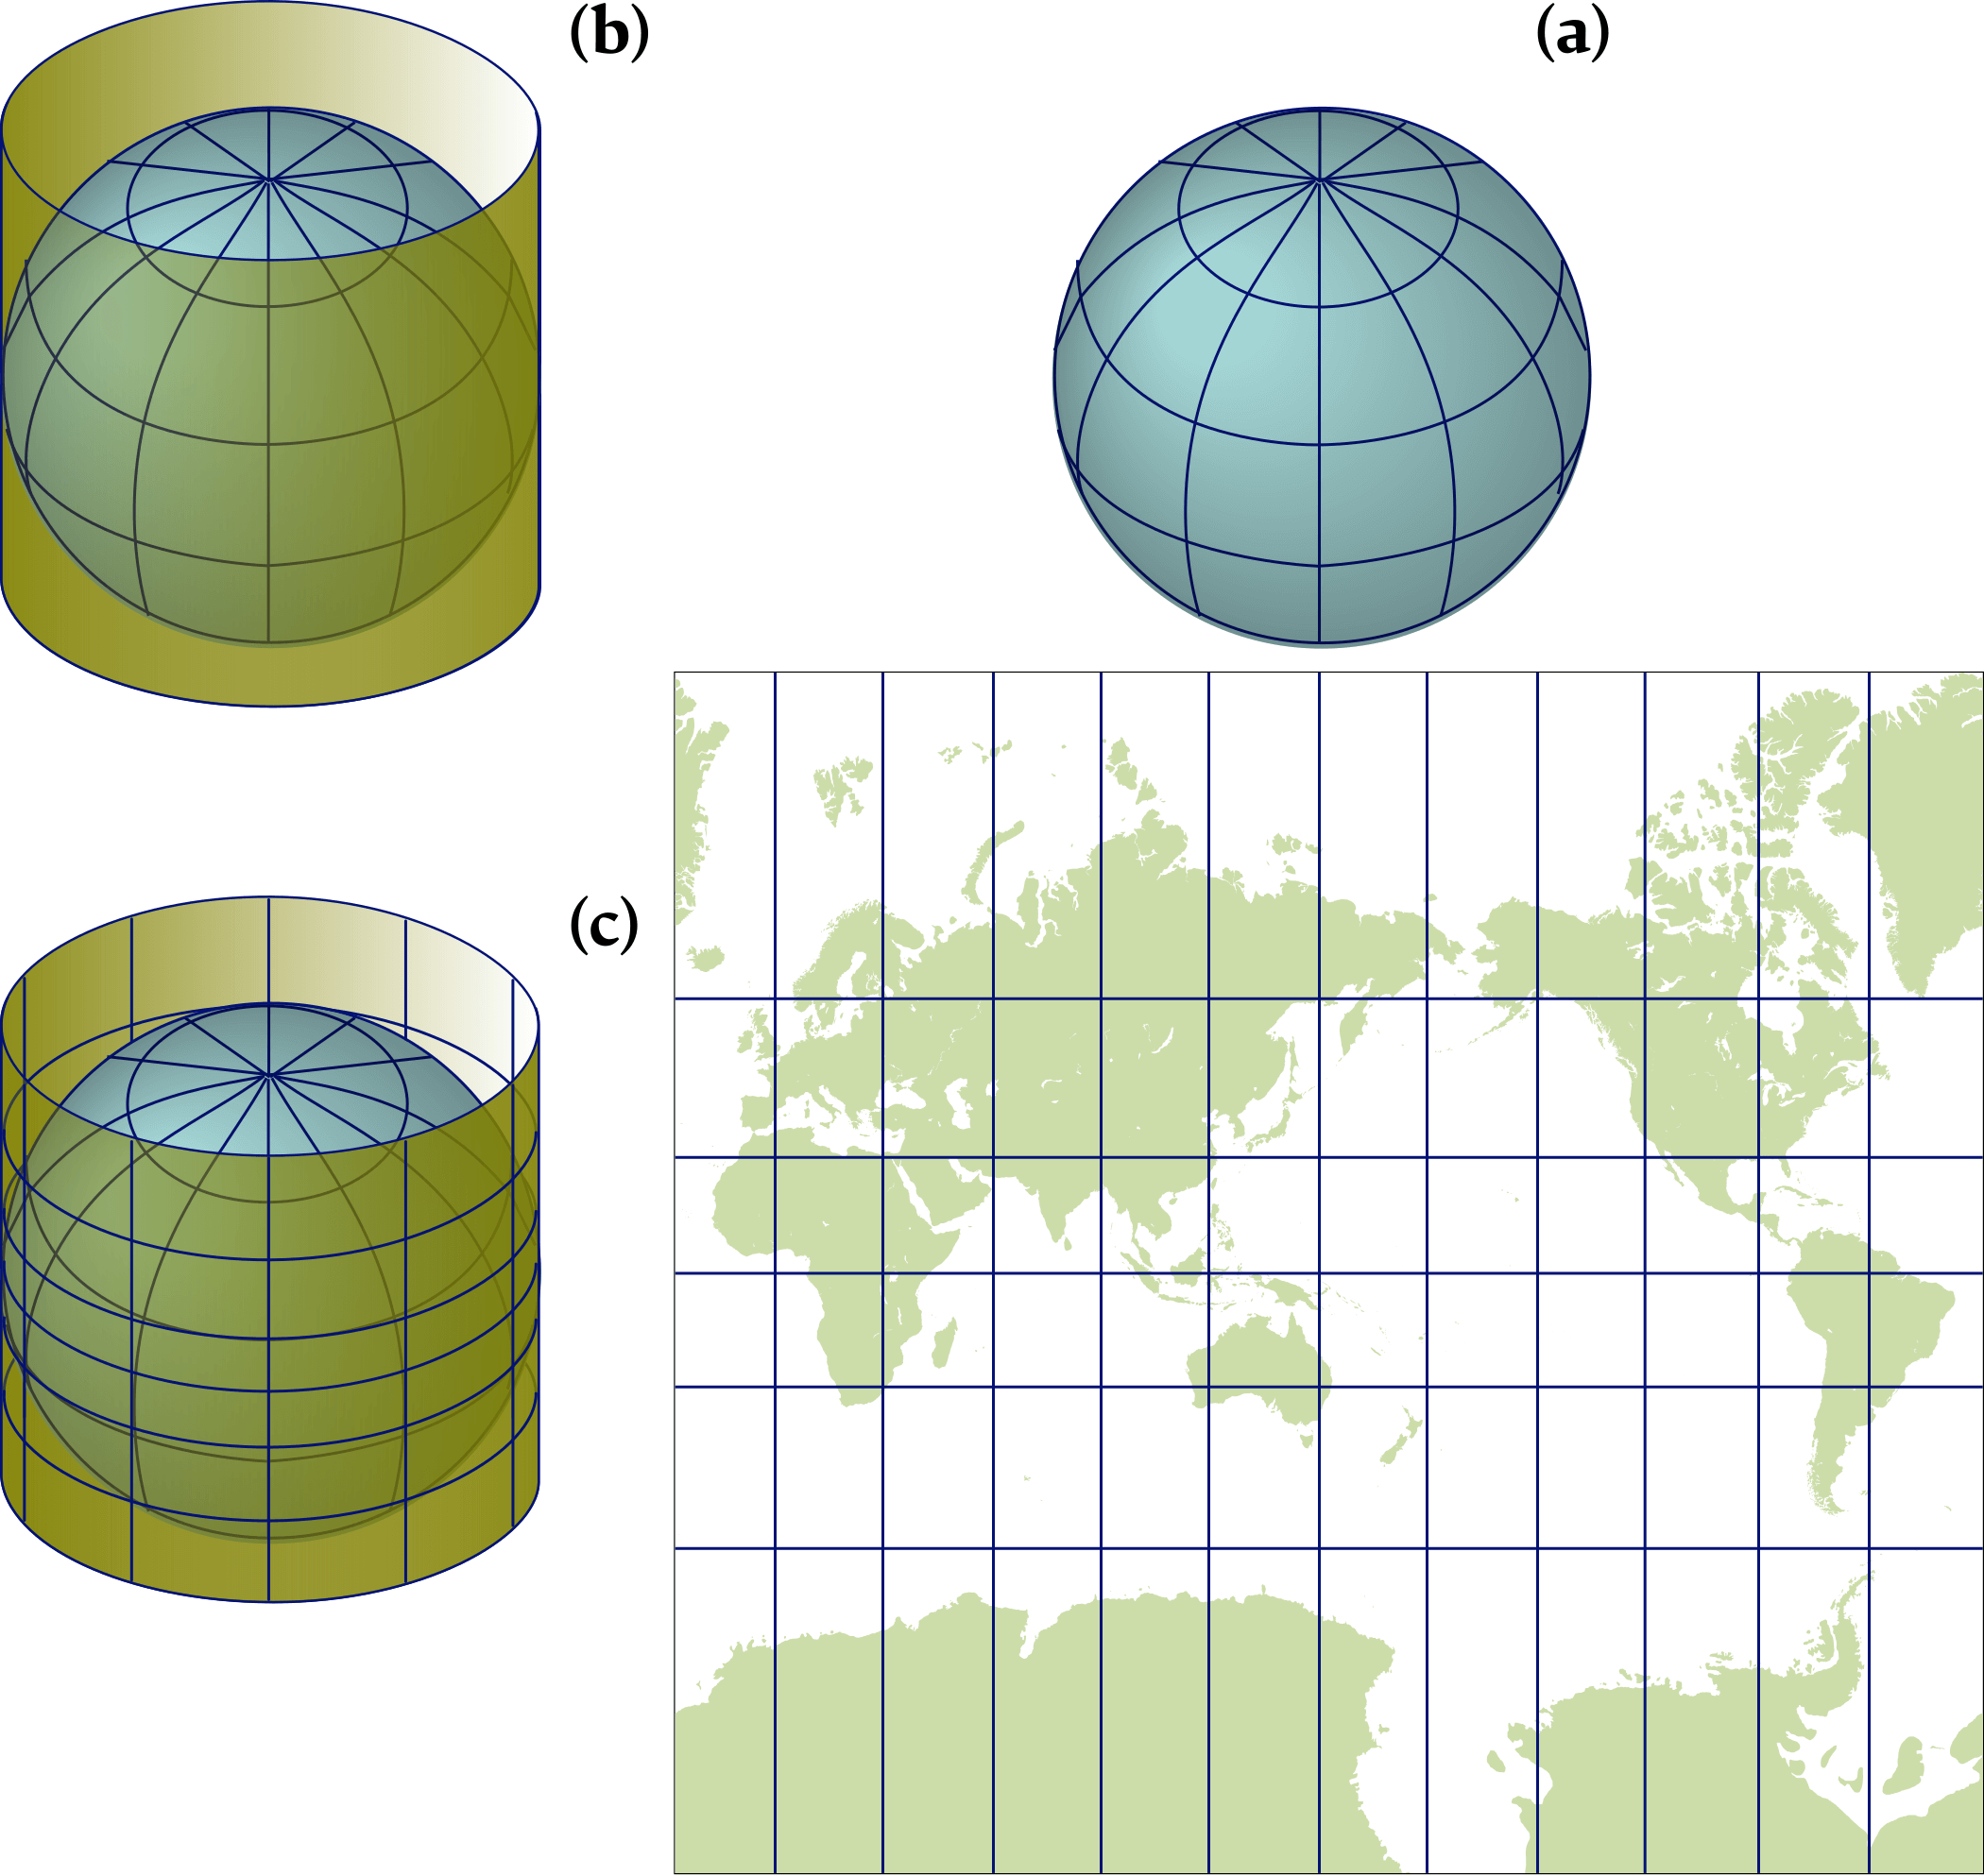
The Mercator chart was designed for nautical navigators and can be constructed by wrapping a cylinder around the planet so that it touches the equator. On this cylinder the surface of the earth is projected and finally the cylinder is cut open to yield the 2-dimensional chart.
Understanding how distortions arise will make it obvious that only the vertical scales should be used for measuring distances.
(a) The globe with the true north facing up.
(b) A cylinder is wrapped around the globe, tangent (i.e. touching) at the equator.
(c) Imagine a light at the Earth's center, projecting the globe on the cylinder, which then can be unwrapped. This cylindrical projection is the basis of the Mercator chart.
This is most prominent when we examine a high parallel. The length / circumference of such a parallel – a small circle – on the globe is much smaller than the equator. Yet, on the chart they have exactly the same length creating a misrepresentation which gets bigger nearer to the poles.
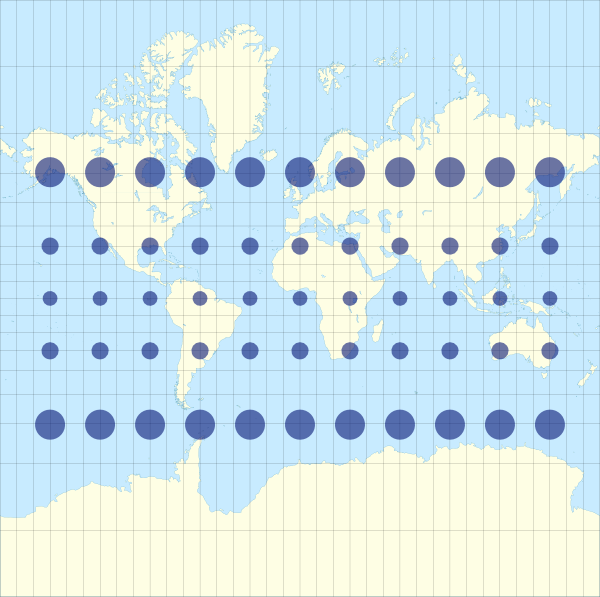
Click on the world map to see the distortions of a Mercator projection. Each navy coloured circle / ellipse has a radius of 500 km.
Vertical scale

Figure 2.3
Horizontal scale
The horizontal scale is only valid for one latitude in the chart and can therefore only be used for the coordinates (a point, but not a line).
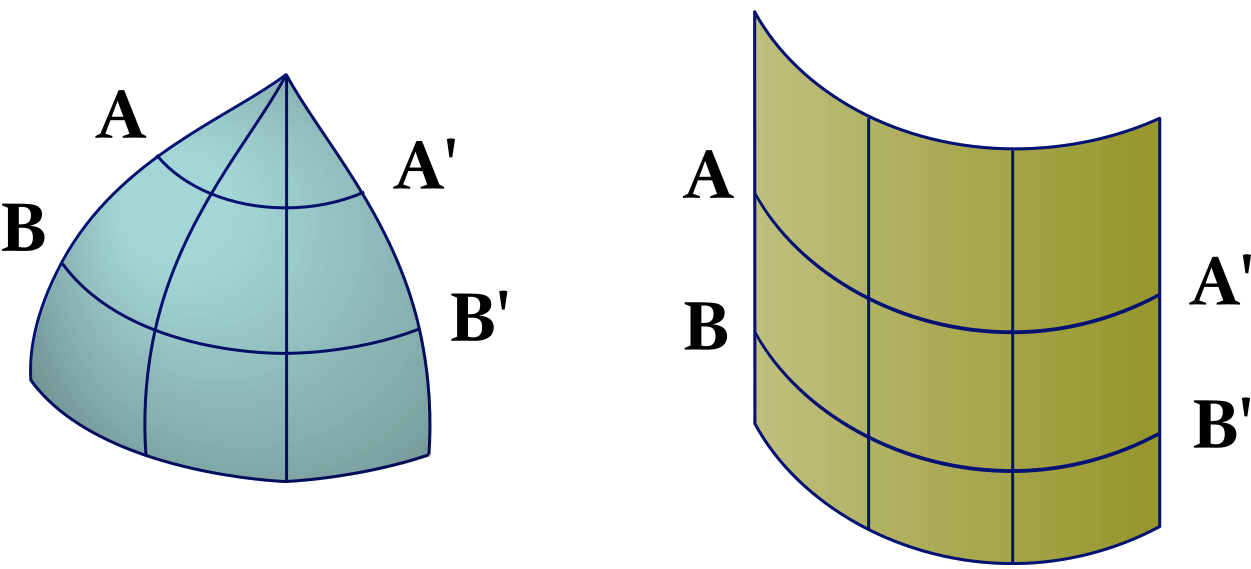
If you were to divide the surface of the earth in eight pieces and lift one out, as shown in Figure 2.4 (left), its projection would result in Figure 2.4 (right).
Now both A – A' and B – B' are as long as the bottom of the chart and are increasingly “too long”.
Additional projections
But there are of course other projections in use by yachtspersons. An important one is the stereographic projection, which is constructed by projecting the globe on a flat plane instead of a cylinder. On this chart parallels appear as slightly curved and also the meridians converge at high latitudes. So, strictly speaking, a straight course will not appear as a straight line in the chart, but the parallels remain perpendicular to the meridians. Most often, distortions are scarcely noticed when this projection is used to chart a small area. Like the Mercator projection, the vertical scale represents a meridian and should be used for measuring distances.
Furthermore there is the gnomonic projection on which the meridians are again converging. But most importantly, the parallels are arcs of a circle while great circles appear as straight lines. On a sphere the shortest route between A and B is not a straight line but an arc (part of a great circle). Though this is also true when you – for example – cross a little bay, we use for simplification a loxodrome (a handy straight line on your Mercator chart which does not reflect your shortest route). On a gnomonic chart this same loxodrome is an arc, while your shortest route (a great circle) ends up as a straight line.
Hence, the gnomonic projection is particularly useful when sailing great circles – offshore and ocean distances – see celestial navigation course — zipped PDF.
The term “gnomonic” relates to a gnomon, a sundial or in particular the raised part of a sundial that casts the shadow; a style.
Organization of the chart: Marginalia
Maps have two basic components:
- the map / chart itself, customarily called the “face”,
- information about the map, commonly called “marginalia”, similar to my own use of marginalia.
The term marginalia comes from a convention that all additional information about the map was printed / drawn outside the edge of the map, i.e. in the margins. This convention has disappeared with time, but the term lives on.
The most important marginalia that should accompany a map are outlined below:
- Authority: the publisher responsible for the information in the chart, e.g. “British Admiralty Charts”.
- Title: the title gives a description of the area covered by the chart, e.g. “The east Mediterranean Sea”.
- Number: different chart types of the same area can be distinguished by the chart's number.
- Projection: most likely the Mercator projection as described above. Charts covering small areas can be constructed by stereographic projection.
- Scale: for example: 1:193 000. But since the chart is distorted this holds only for one specific latitude in the Mercator chart. The scale indicates how detailed the chart is (here 1 cm on the chart represents 193 thousand cm on the Earth).
- Horizontal geodetic datum: the definition of the relationship between the ellipsoid adopted as the model of the Earth's shape, and the Earth itself. Though there are hundreds of datums in use, most are only locally valid.
Yet, the WGS-84 datum is global in scope and positions obtained by satellite navigation systems are usually referred to this datum. Therefore, a correction needs to be applied to a WGS-84 GPS position to agree with charts using other horizontal datums. For example to correct WGS-84 to the European datum, add e.g. 0,06' N 0,04' E (style guide) to the WGS-84 position indicated by the GPS. Fortunately, most chart plotters may be set to display positions in several other datums besides WGS-84 and perform the calculations for you. Comparisons of WGS84, ETRS89 and ITRS. - Chart sounding datum: the tidal datum to which soundings and drying heights on a chart are referred. Often shortened to “Chart Datum” when it is clear that reference is not being made to a horizontal datum. Chart sounding datums are also used as reference for heights (lighthouses, mountains, bridges). Multiple datums can be used in one chart: LAT for soundings and ML for heights; see Chapter 6Chapter 6.
- Soundings & height units: soundings and heights can be stated in – for example – metres, feet or fathoms. Today all charts worldwide should by now be metric, except for USA Hydrographic Office charts, which sometimes still use feet instead of the international standard.
- Horizontal scale: natural scale at for example 40° 15,3' S latitude where the horizontal scale can be used for measuring distances and where the chart scale is true.
- GPS compatibility: most charts neither have the precision nor the resolution to fully use the GPS / Galileo / GLONASS positioning potential. Moreover, still plenty of charts result from surveys done in the 19th century.
Also, as mentioned above, GPS data often requires a correction for a local horizontal chart datum before it can be used in the chart. - Corrections & edition: the chart is for example a 2019 edition but is – when properly corrected – still valid in 2028. Corrections are published continuously and the changes made should be mentioned in the bottom left corner of the chart.
Information in the chart
- Depths reduced to Chart Datum: a sounding like 35 indicates 3½ metres of water under Lowest Astronomical Tide (LAT) – which is commonly the Chart Datum.
An underlined sounding like 04 indicates a height of 40 cm above LAT. Heights above Chart Datum on drying areas are given in metres and decimetres. The metres figure is underlined.
Depths are given from 0.1 to 20.9 in metres and decimetres, and from 21 to 31 in metres and half metres. Greater depths are rounded down to the nearest safest metre (for example, 32.7 metres is rounded down to 32 metres).
The geographical position of a sounding is the centre of the depth figure. - Isobaths or contours: lines connecting positions with the same depth.
- Heights reduced to chart datum: heights of for instance, lighthouses, mountains and cliffs are more often reduced to another datum such as Mean High Water (MHW) or Mean High Water Spring.
- Tidal information: details of both the vertical (see Chapter 7see Chapter 7) and the horizontal (see Chapter 8see Chapter 8) movement of the water is often included in the chart.
- Lighthouses, buoys & marks: characteristics of lights, buoys and marks, see Chapter 9Chapter 9.
- Seabed qualities: pebbles, seaweed, rocks, wrecks, pipelines, sand and other seabed characteristics for anchoring.
- Magnetic variation: angle between the "True North” and the “Magnetic North” varies in place and time. The local variation is indicated in the compass card / compass rose, see Chapter 3Chapter 3.
- Landmarks & conspicuous positions on the shore: churches, radio masts, mountain tops, etc. that can be used for compass bearings and other means of navigation, these will be put to good use in Chapter 4Chapter 4.
Coordinates and positions
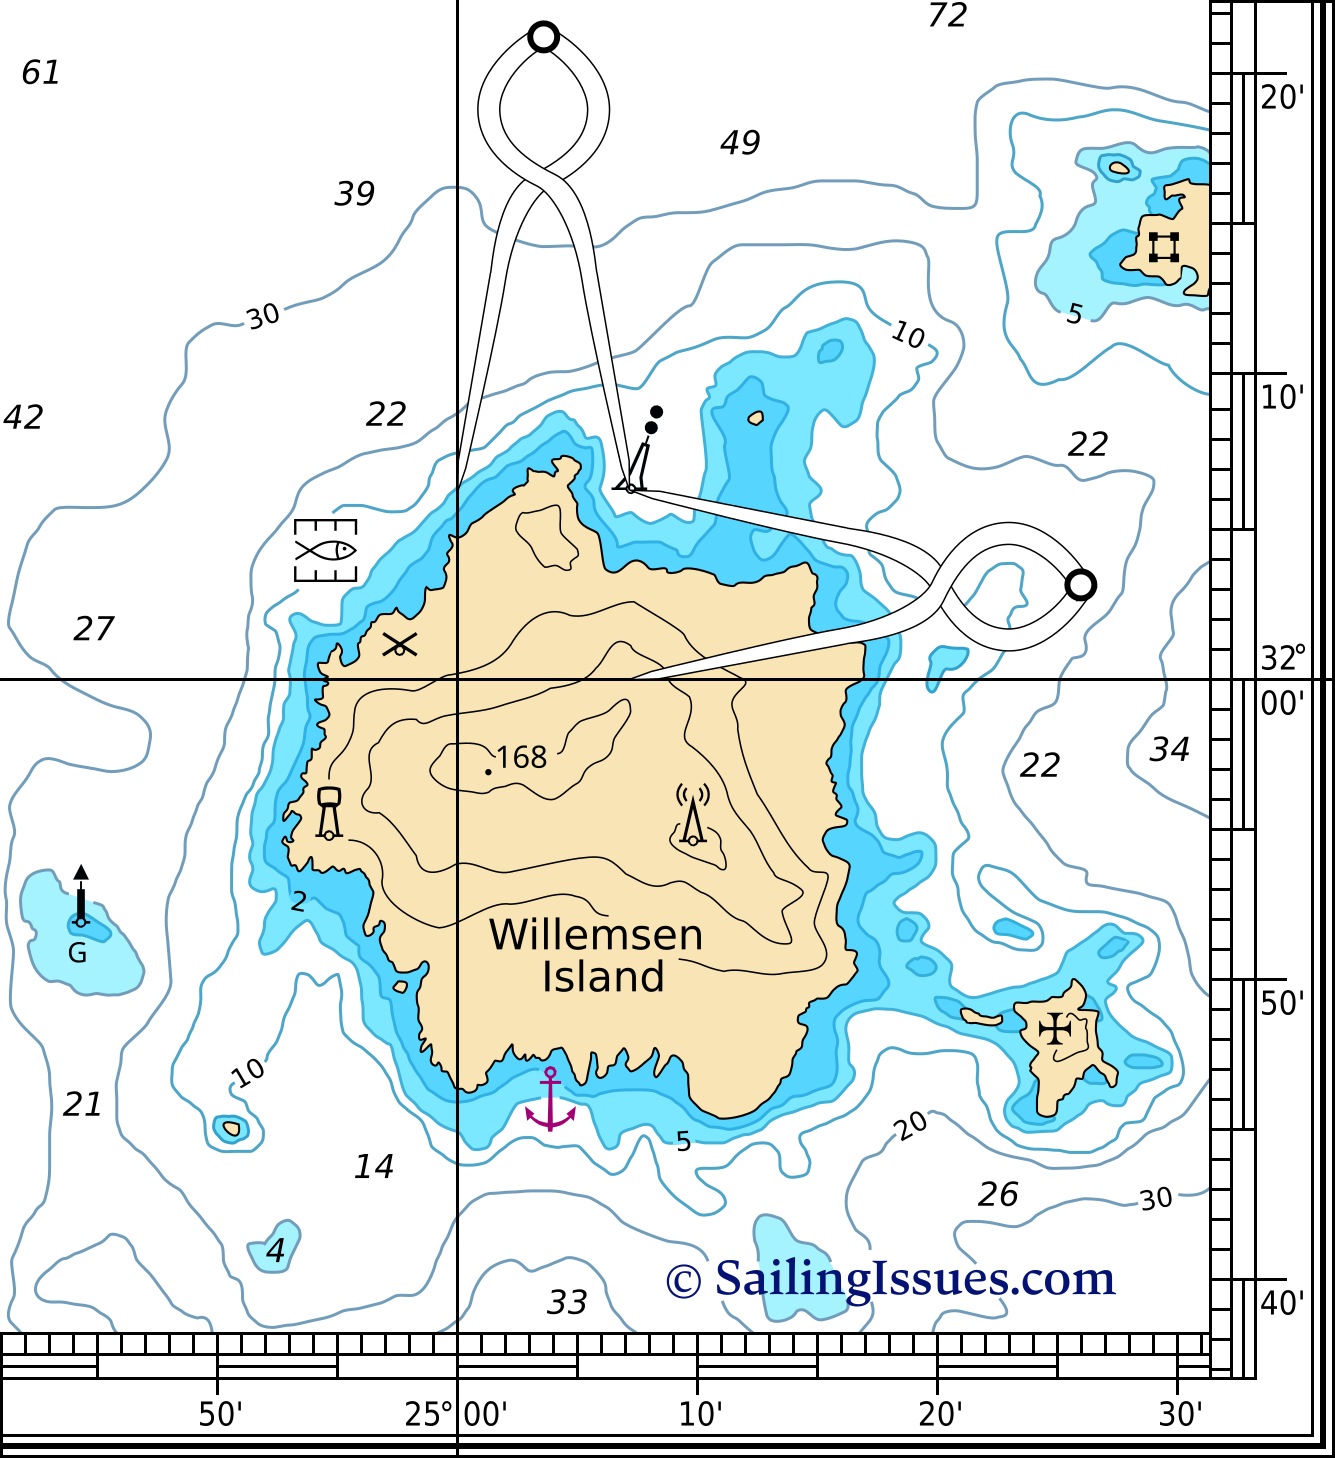
A pair of nautical dividers (single handed dividers) is used to obtain precise coordinates from the chart.
This device enables you to take the distance between that particular position and the closest grid line, see Figure 2.5 below. You then place the dividers on the scale with one end on this grid line, leaving the other end precisely at your coordinate. Do this twice to get both latitude and longitude at the scale on the edge of the chart.
Following you will find some examples, an excerpt from the PDFs :
| Danger mark 32° 06,3'N 25° 07,3' E |
 |
|
| Fish farm 32° 04,4' N 24° 54,7' E |
||
|
|
Anchorage 31° 46,0' N 25° 04,0' E |
|
| Church 31° 48,4' N 25° 25,0' E |
||
| Windmill 32° 01,0' N 24° 57,8' E |
||
| Castle 32° 14,2' N 25° 29,6' E |
||
| Water tower 31° 54,9' N 24° 54,8' E |
||
| Radio / TV mast 31° 54,8' N 25° 10,0' E |
||
| Beacon green 31° 52,0' N 24° 44,3' E |
to plot coordinates on the chart.
or to find coordinates of a symbol or location from the chart.
Plotting a position onto the chart is done by reversing this method.
Some chart symbols come with a line and circle ![]() indicating the precise location, like the “Radio mast”, otherwise the center of the symbol, or its placeholder, is the precise location.
indicating the precise location, like the “Radio mast”, otherwise the center of the symbol, or its placeholder, is the precise location.
Another possible notation of
33° 28,5' E is
33° 28′ 30" E, which however doesn't easily allow for more precision like
33° 28,500' E does.
Also note that in most countries a comma – and not a period – is used as the decimal separator. Both 33° 28.500' E and 33° 28,500' E are valid notations.
Distances
To measure the distance between, for instance, the two oil rigs of Figure 2.6, we will again need our dividers. Remember, we can only use the vertical scale.
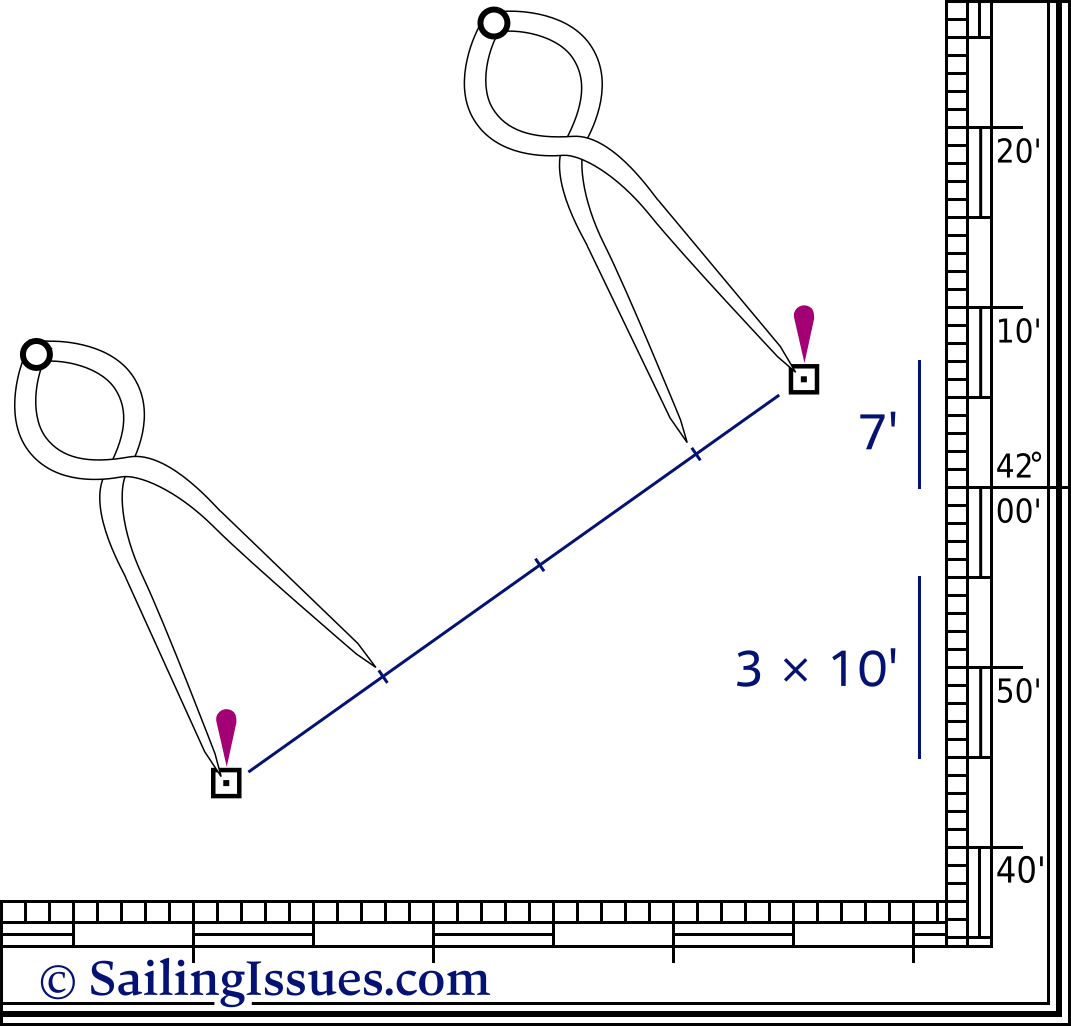
We first take a convenient distance like 10' (10 nautical miles) on the vertical scale using the middle latitude. Then we start walking with the dividers from the southern oil rig to northern one. Finally, we adjust the dividers to measure the small remaining part at its own height, i.e. its own latitude; caution were you to measure it below 42°, you would read 6.8' instead of 7'.
The image shows that the total distance is 37 nautical miles, or 37 NM.
Courses
So, now we can measure distances and both plot and read out positions, but we also need directions. For example we need to find the course from safe-water buoy A to safe-water buoy B. To accomplish this we may use a parallel rule aka parallel ruler as shown in the chart of Figure 2.7 below:
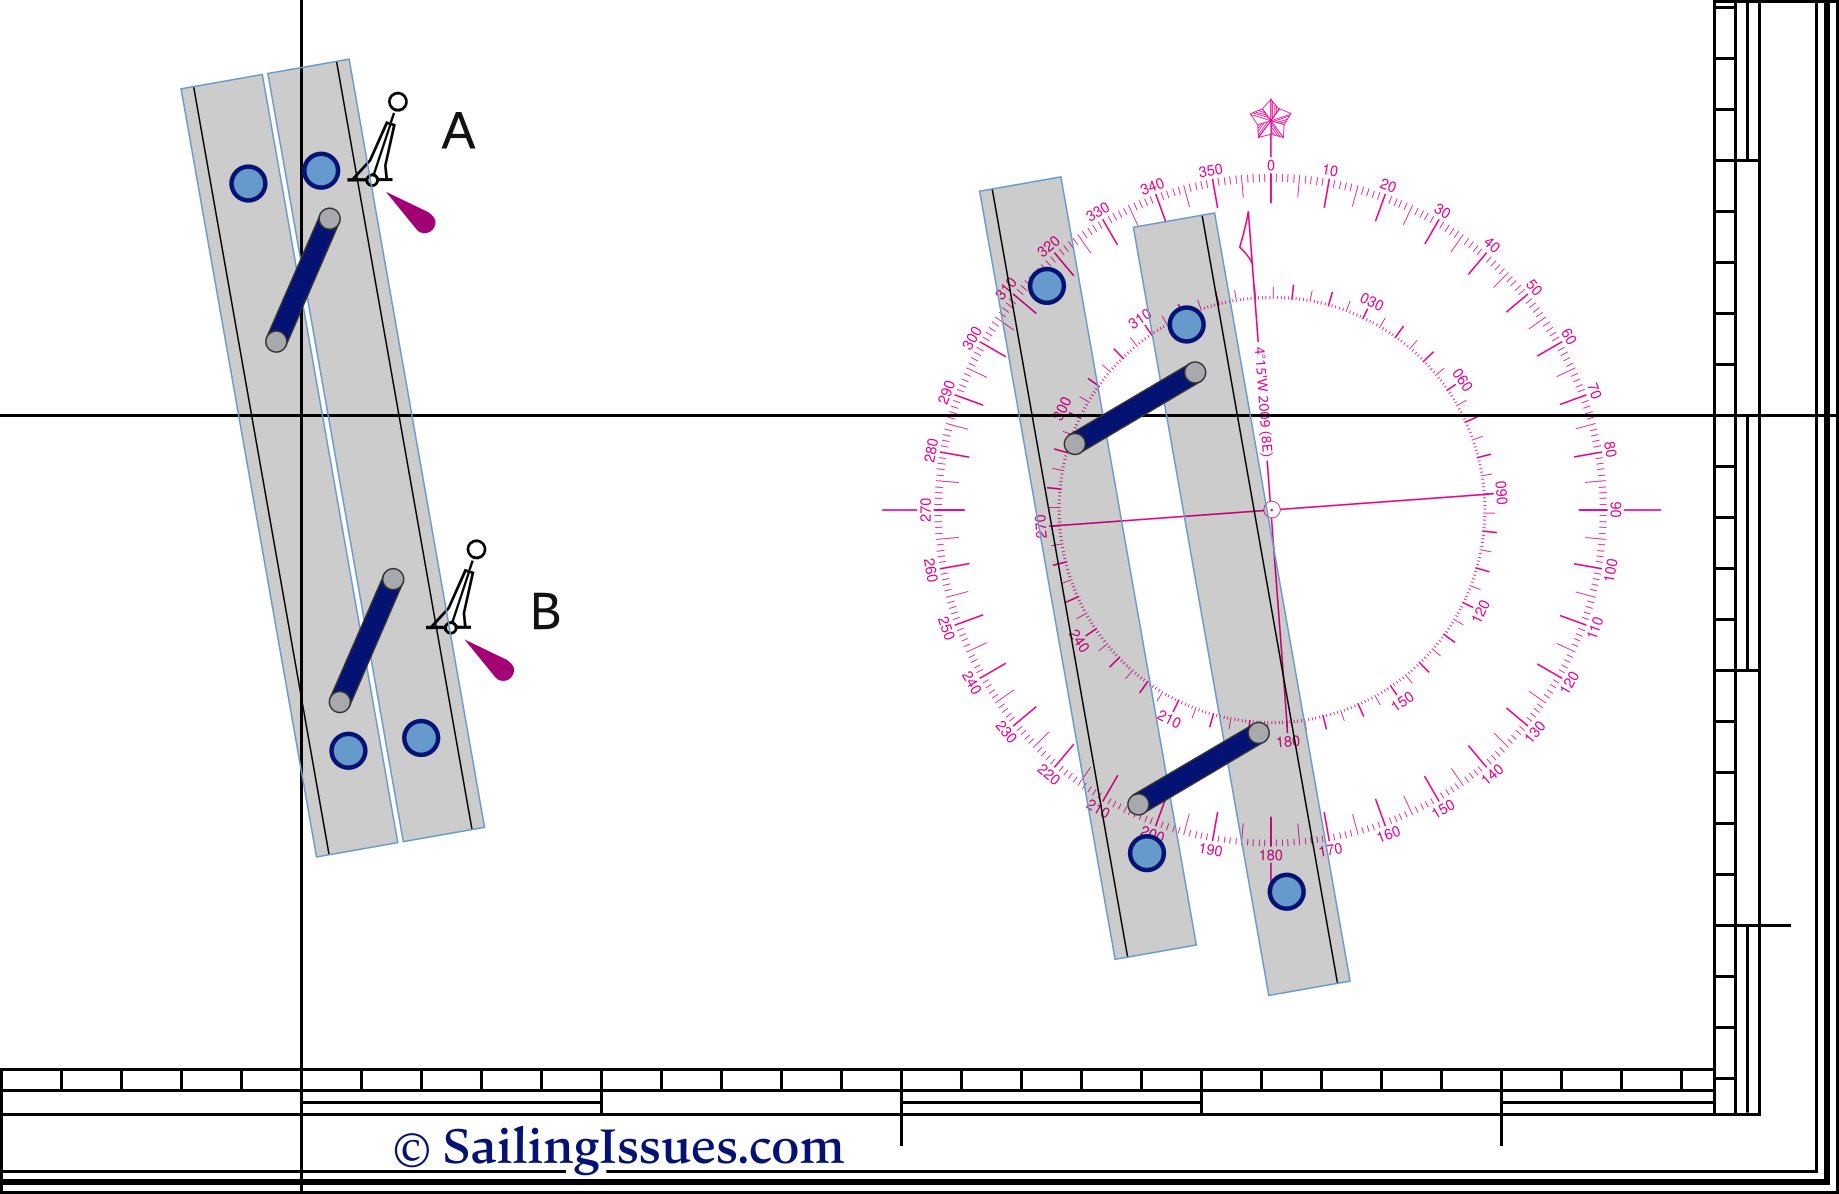
Using a parallel ruler.
First you line this instrument up with the two buoys. Then follows the intriguing part in moving the device to the compass rose without losing its alignment. Finally, when one of the rules is aligned with the heart of the compass card, you can read course A to B. In this example: 170°.
Besides the parallel rules there are other types of instruments available, notably the Breton Plotter – also known as a Portland Course Plotter – which features an adjustable rose.
Selection of chart symbols
Wrecks, dangers, soundings and rocks
| Chart symbol | Meaning |
|---|---|
| Danger line in general | |
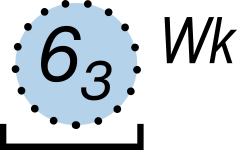
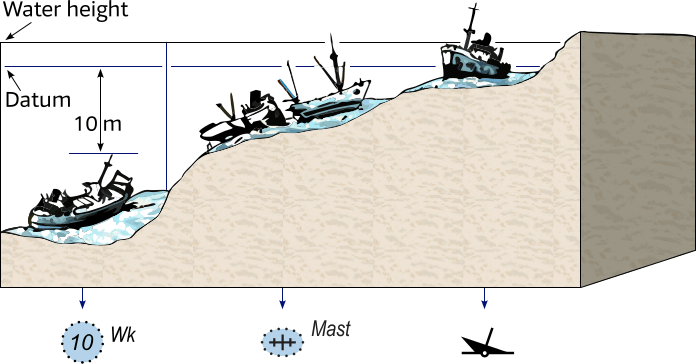
| Wreck, least depth unknown but usually deeper than 20 metres | |
| Visible wreck | |
| Wreck of which the mast(s) only are visible at Chart Datum | |
| Wreck or obstruction, least depth known obtained by sounding only | |
  |
Wreck or obstruction, least depth known, swept by wire drag or diver |
|
|
Rock which covers and uncovers, height above Chart Datum |
| Rock awash at the level of Chart Datum | |
| Underwater rock of unknown depth, dangerous to surface navigation | |
| Underwater rock of known depth, dangerous to surface navigation | |
| Remains of a wreck, or other foul area, non-dangerous to navigation but to be avoided by vessels anchoring, trawling etc. | |
| Depth unknown, but considered to have a safe clearance to the depth shown | |
| Sounding of doubtful depth; Existence doubtful; Reported, but not confirmed | |
| Position approximate; Position doubtful |
Landmark (placeholder) chart symbols
| Chart symbol | Meaning |
|---|---|
| Wind turbine; Wind farm | |
| Chimney | |
| Monument | |
| Marina - boat harbour | |
| Mosque / minaret | |
| Silo | |
| Tanks | |
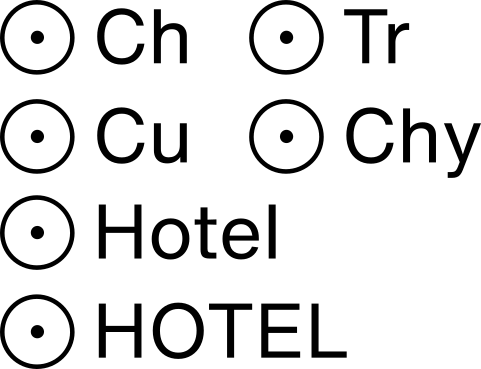 |
Placeholder examples: Church (Ch) Tower (Tr) Cupola (Cu) Chimney (Chy). CAPITALS indicate that the landmark is conspicious. |
| Quarrie, mine | |
| Flare stack, gas flare |
AtoN chart symbols
| Chart symbol | Meaning |
|---|---|
| Major light (e.g. lighthouse); minor light (e.g. harbour light) More on lights in Chapter 9More on lights in Chapter 9 |
|
 |
Limit of safety zone around offshore installation |
| Position of tabulated tidal stream data with designation “A”; Tidal levels data “a”. | |
| Green or black buoys (symbols filled black): G = Green ; B = Black | |
| Single coloured buoys other than green and black: Y = Yellow ; R = Red | |
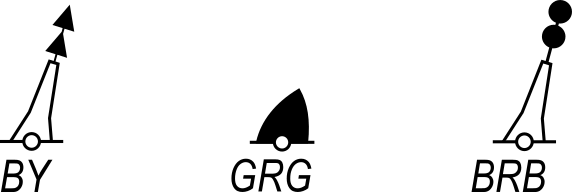 |
Multiple colours in horizontal bands, the colour sequence is from top to bottom |
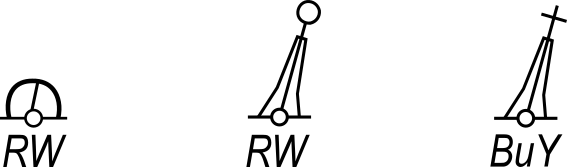 |
Multiple colours in vertical or diagonal stripes, the darker colour is given first. W = White ; Bu = Blue More on buoys in Chapter 9More on buoys in Chapter 9 |
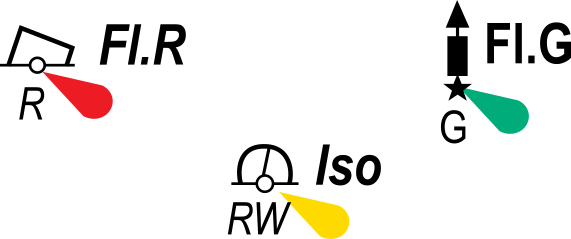 |
Lighted marks on multicoloured charts, GPS / Galileo / GLONASS displays and chart plotters.
A yellow coloured lobe indicates a White light! Also note that beacons (here the rightmost symbol with the green light) has an upright G, instead of an oblique G. |
Course • Heading • Bearing
The course is the intended direction of travel, which on an electronic chart plotter becomes the Course over Ground (COG), or Track (TR), i.e. the actual direction steered; see Track versus CourseTrack versus Course.
Heading is the constantly changing direction in which a vessel is pointing at any given moment. For example, a helmsperson may intend to steer a course of 060°, but the heading one moment is 069° and the next moment it is 051°. However, the course remains 060°.
A bearing is the direction between two objects, measured in degrees of angle with respect to north. So, if we have taken a bearing of 270° on a lighthouse, we are exactly east of it; see relative and compass bearingsrelative and compass bearings.
Plotting Instruments
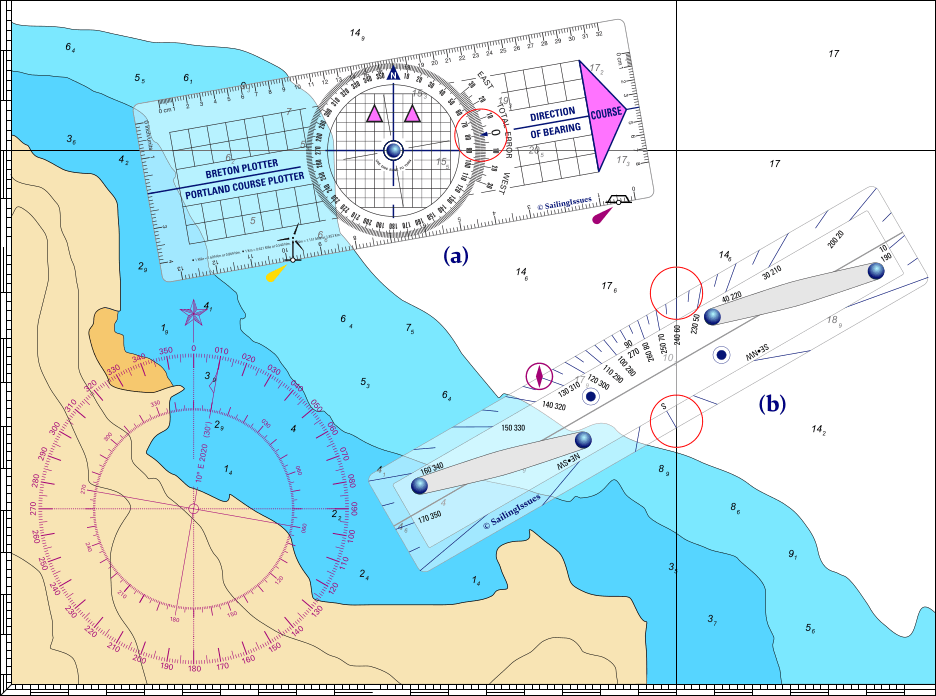
Aside from the “plain” parallel rule(r) we used in Figure 2.7 there are other purposeful navigational tools to plot bearings and courses in the chart, or to determine a course or bearing, e.g. between two fixed navigational points as illustrated in Figure 2.10. Worth mentioning are the Breton Plotter, Douglas Protractor, Captain Field's Improved Parallel Rule and the Protractor Triangle.
Breton Plotter
The Breton Plotter contains a ruler with a rotating protractor that serves as a compass rose, see Figure 2.9, allowing us to plot a course on charts by aligning the north of the ruler with the north of the chart.
The name refers to Yvonnick Gueret – a Breton fisherman, navigator and captain – who developed the protractor in the 1960s while teaching navigation with a Cras Plotter.
Because Gueret noticed that students had difficulty using the more complex plotters common at the time, he decided to contrive his own.
Put on the market as “Rapporteur Breton” (rapporteur is french for plotter) in 1979 without suitable patents, Gueret's design was quickly “copied” by manufacturers such as Weems & Plath and Portland, hence the other familiar name: Portland Course Plotter.
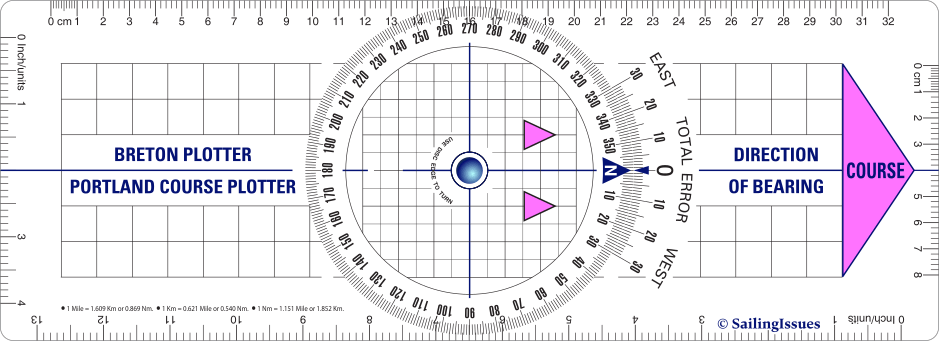
This intuitive navigational ruler contains a rotatory protractor (its own compass rose) which can be adjusted to line up with the meridians and parallels in the chart, while the ruler itself is aligned with the bearing or course. It also allows direct compensation for compass errors, and features graduations (notably in convenient units) for drawing vector diagrams, like CTSCTS.
How to use the Breton Plotter
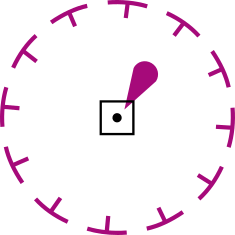
- To plot a bearing or course (or draw any line in a particular direction); in which case the direction is known, let's say 310° on a lighthouse.
Rotate the protractor so that it reads 310° at the arrow on the fixed part. Make sure that the arrows (here in vivid purple) point in the direction of the bearing; i.e. toward the lighthouse.
The whole plotter is then rotated until the protractor's grid becomes aligned with the parallels and meridians of the chart.
At the same time the plotter is positioned next to the lighthouse symbol from where we can plot the bearing on the chart. - To determine a course or bearing; in which case the direction is not known, for instance between two buoys.
The instrument is laid along the line connecting these two objects, see the example in Figure 2.10, and then the protractor is rotated so that the its grid becomes aligned with the parallels and meridians of the chart. The bearing is read off against the scale on the fixed part: 080°.
To correct for magnetic variation and find a magnetic coursemagnetic course, peek ahead to Chapter 3 Compass errors with a Breton PlotterChapter 3 Compass errors with a Breton Plotter. - To find Course to SteerCourse to Steer, peek way ahead to Chapter 8 CTS with a Breton PlotterChapter 8 CTS with a Breton Plotter.
Using these plotters requires less manual dexterity than the “plain” parallel rulers since the latter needs to be moved about the chart.
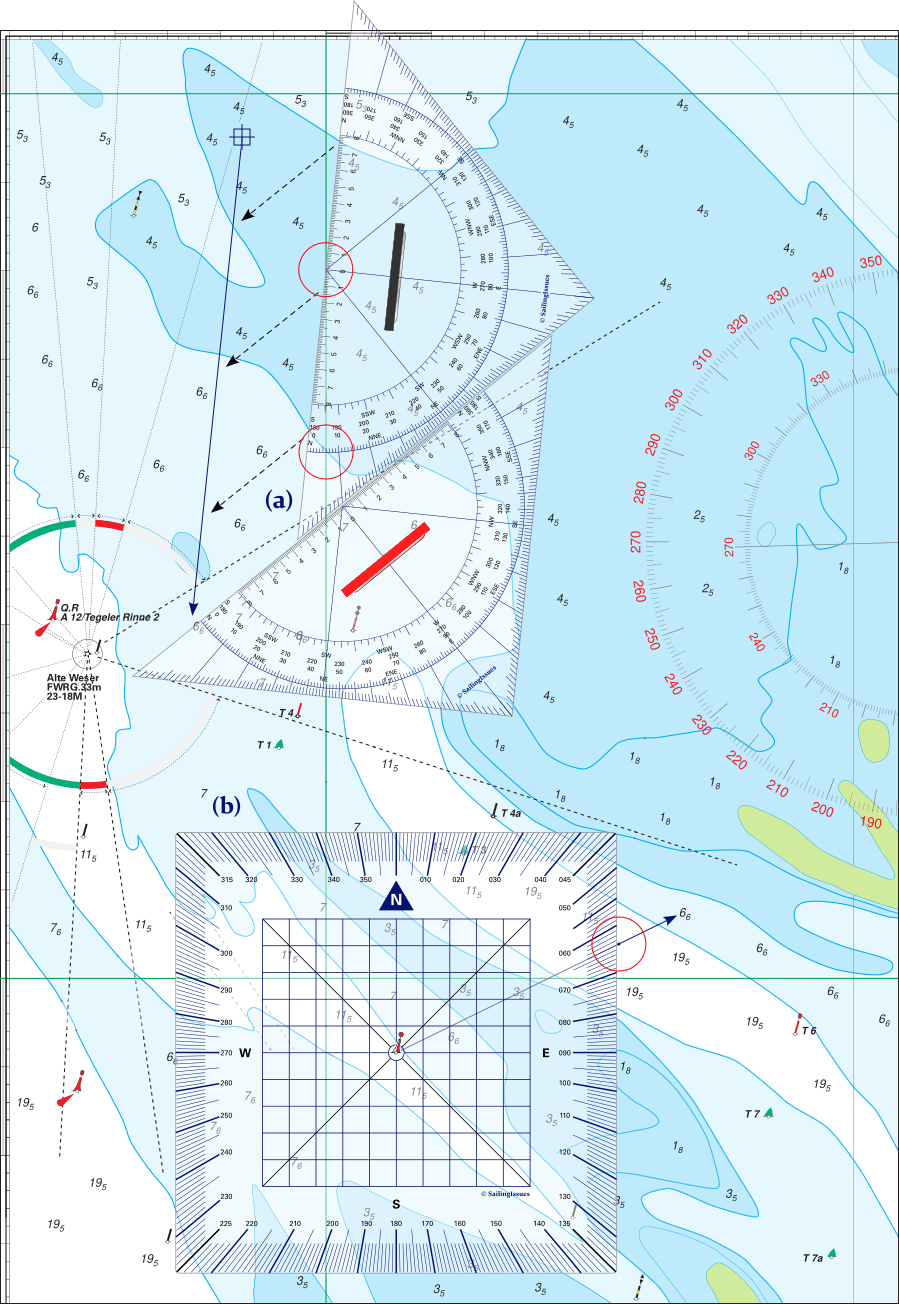
(a): Lay the edge of the Breton Plotter along the line between the wind turbine and the superbuoy with the vivid purple arrows in the direction of the course; here toward the superbuoy.
Swivel the compass rose until N is pointing north and the grid lines up with a convenient line of latitude or longitude. The course is read off against the scale on the fixed part: 080°, highlighted by the red circle.
(b): Captain Field's Improved Parallel Rule: a Parallel Rule that includes a protractor scale.
From the pilot boat's station
 we need to plot a true course of 060°.
In the closed position, let the S (centre) on the lower section cross a meridian and rotate till the 60° mark on top section crosses that same meridian; this is accented by the red circles.
we need to plot a true course of 060°.
In the closed position, let the S (centre) on the lower section cross a meridian and rotate till the 60° mark on top section crosses that same meridian; this is accented by the red circles.
Note that you can only use the vertical lines (meridians).
Captain Field's Improved Parallel Rule
Parallel Rules were first invented in 1584 by a Frenchman named Mordente, but only became common in navigation in the 18th century.
In the 1854 a retired sea captain, Captain William Andrew Field (Feild) (c. 1796 – 1871) had one of the outer edges of the original Parallel Rule divided into degrees like a protractor, with the opposite edge divided into points, half-points and sometimes quarter-points – the (sub-)cardinal directions of the compass. This made it easier to read off the bearing of a line than with a “plain” Parallel Rule, which had to be moved across the chart to the nearest compass rose.
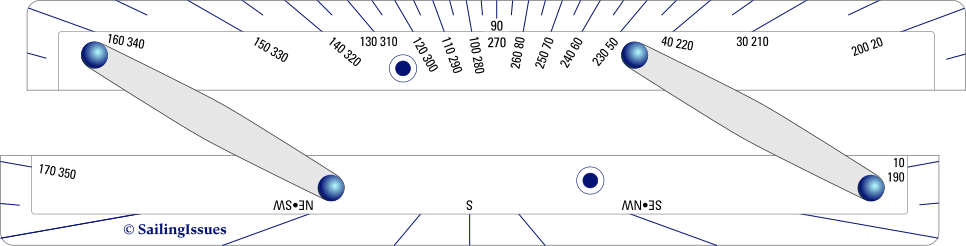
The lower rule features a built-in scale of cardinal points (north, east, etc) and intercardinal points (e.g. between north and east there are NNE, NE, and ENE).
The top rule has a protractor-style scale to its upper edge, with the focal point in the middle and on the outer edge of the lower rule when in the closed arrangement.
Douglas Protractor
This light and simple navigational protractor, see Figure 2.12, was invented by Captain HP Douglas (senior hydrographer of the royal navy) in 1914. Continuously in use since the 1930s by airmen, it features rarely on naval vessels, except on very small craft.
- To determine a course or bearing (or measure an unknown direction of any line) on the chart.
Place the Douglas Protractor with its central hole on the line and its grid aligned, by eye, with the nearest meridians and parallels. The direction of the line can then be read directly off the scale.
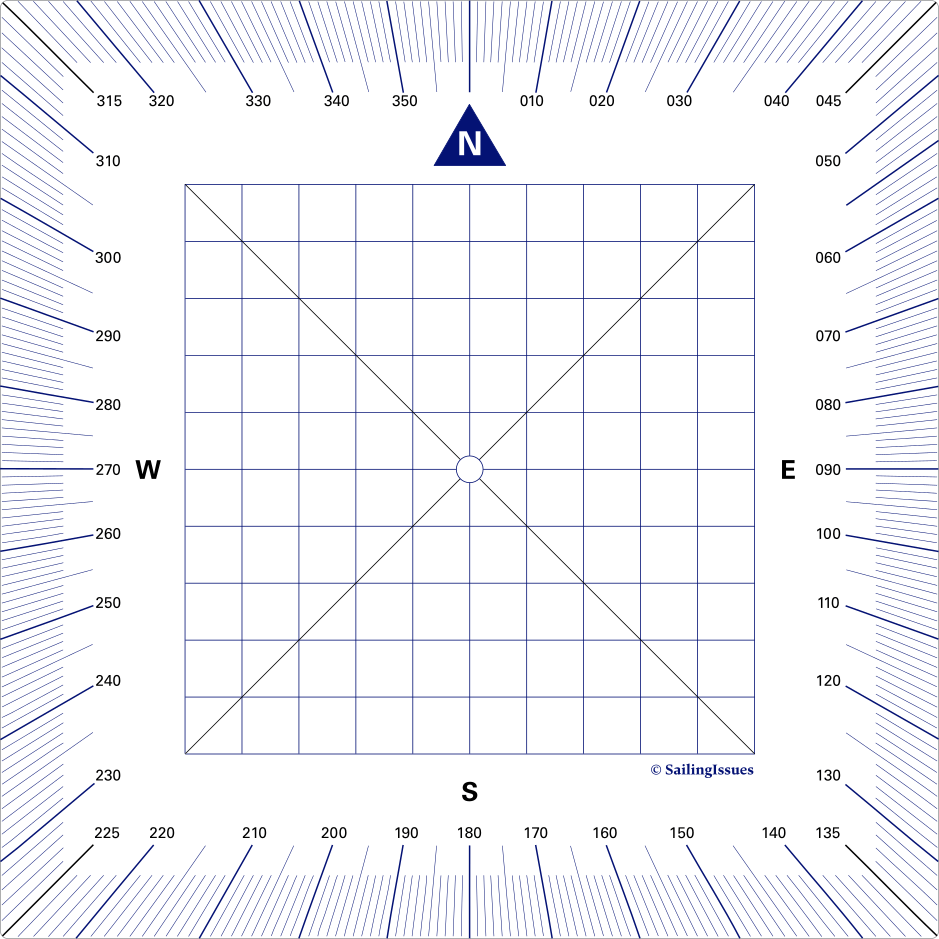
On the inside is a grid of equally-spaced lines, parallel to the edges of the protractor; and in the centre is a small hole.
- To plot a bearing or course (or draw any line with a known direction) we can use a similar technique, see the example in Figure 2.15 (b).
Place the central hole of the protractor over the starting point of the line, ensure that the protractor’s grid is lined up with the meridians and parallels, and make a light pencil mark on the chart alongside the required direction on the scale. Then move the protractor and use its edge to draw a straight line from the starting point through the pencil mark.
Protractor Triangle
This versatile instrument is known under various names, such as 45–45–90 Navigation Protractor Triangles or set squares (USA), Kent-type (UK, after a stationery manufacturer), Inoue-type A/B (JP, after Prof. Inoue), course triangle + supporting triangle, Anlegedreieck + Kursdreieck (DE).
With the Protractor Triangles we either start or finish with the focal point of one of the triangles on a meridian, see Figure 2.14. By using the meridians we don't need the compass rose in the chart except for finding local magnetic variation.
Start on the meridian to plot a course or bearing, and finish on the meridian to determine the direction between two objects.
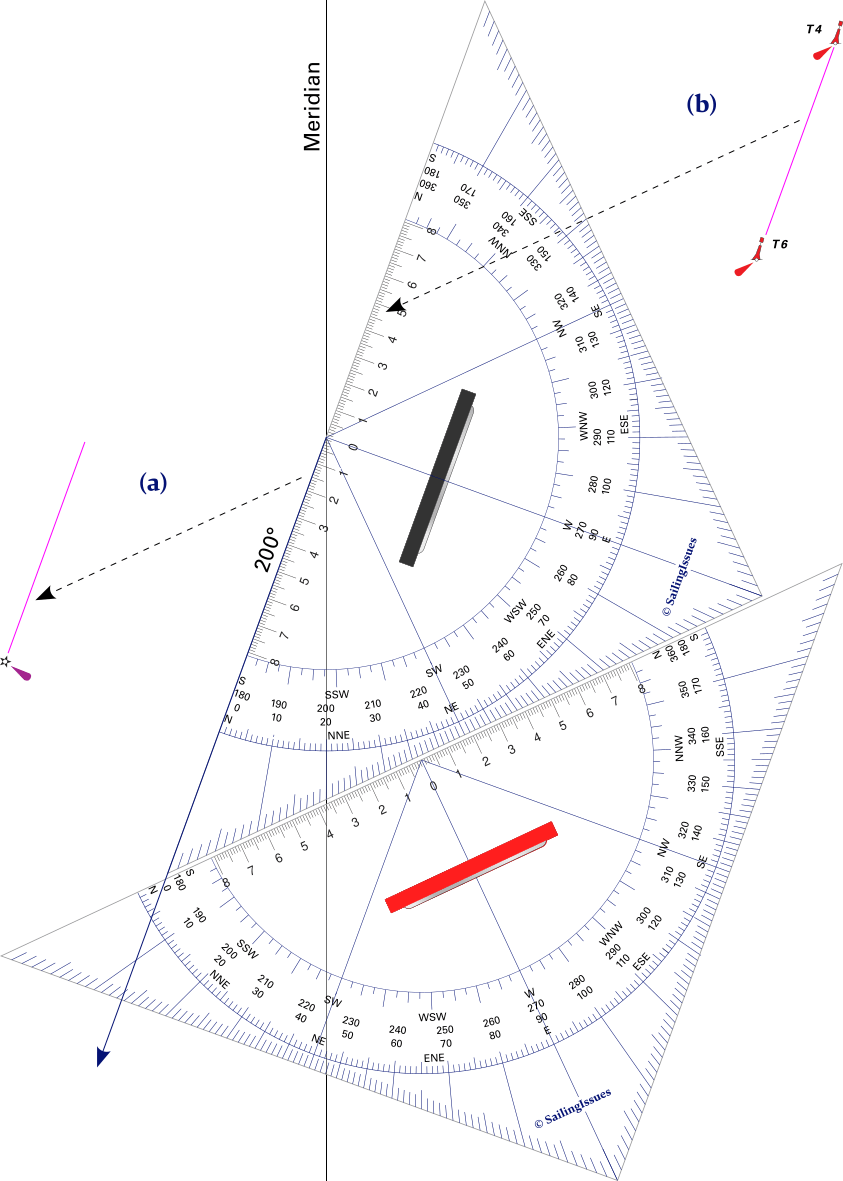
The dotted lines illustrate sliding motion. The vivid purple lines are the bearing and course line.
(a) To plot a bearing or course, i.e. direction is known, e.g. a bearing of 200° on the major light.
We start on a meridian, rotate the course triangle around its focal point to 200° and slide it to the lighthouse. We use a second triangle (red handle) to slide it along.
(b) To determine an unknown direction e.g. the course from T4 to T6.
We first position the triangle along the line between these lateral buoys, then slide to place the focal point on a meridian and read the direction from where to meridian “exits” the triangle. Make sure you read 200° and not the opposite direction of 20°.
How to use the Protractor Triangles
The protractor scale allows us to align the “course triangle” (black handle) with a meridian, in the example of Figure 2.14 we do so at 200°.
The course triangle can be kept at this angle by sliding it along the “supporting triangle” (red handle) to the desired location.
Note that this second triangle does not depend upon any graduations to function as a supporting triangle and is sometimes left blank as portrayed in Figure 1.8 (b)Figure 1.8 (b).
- To determine the direction of a course or bearing (one triangle).
If this line crosses any meridian (line of longitude) printed on the chart, then only one triangle is needed.- Place the focal point of the triangle (= where all lines come together) directly on top of the spot where the line to be measured crosses the meridian.
- Rotate the triangle around the focal point so the hypotenuse (the side of the triangle opposite the right angle) is on top of line you want to measure.
- Read the direction from where to meridian “exits” the triangle.
- To determine the direction of a course or bearing (two triangles).
If the line does not cross a printed meridian, then a supporting triangle is required.- Line up the hypotenuse on course line.
- The second triangle is placed to support first triangle as it is moved until the focal point is positioned on the meridian.
- Read the direction from where to meridian “exits” the triangle.
- To determine when we are abeam an object.
Often we are keen to know when an object becomes perpendicular to our course – “abeam” is defined as “in a line at right angle to the ship's keel” – since at that moment we would be closest to this object.- Place the hypotenuse of the first triangle on the course line.
- Adjoin a cathetus (= short edge) of the second triangle against the first triangle and move it so the other cathetus passes through the object.
- To plot a course or a bearing; see the example in Figure 2.15 (a).
- Start with the focal point of the triangle on a meridian.
- Rotate the triangle around the focal point to the desired direction; this angle can be read from where to meridian “exits” the triangle.
- Slide the triangle to the object from where we want to plot a bearing or course. We use a second triangle (red handle in our examples) to slide it along.
(a) Protractor Triangles: place the focal point of the course triangle on the nearest meridian. Rotate to the desired degree (here 186°, see red circle). Then move the course triangle until it passes through the ship’s location at our waypoint
 , by sliding it along the supporting triangle.
(b) Douglas Protractor: to plot a course of 064° starting from the safe water mark.
Place the central hole of the protractor over the buoy, align the protractor’s grid with the meridians and parallels, and mark with a pencil on the chart on the outside of the protractor's scale (highlighted by the red circle). Draw the course line by connecting this mark with the safe water mark.
Comparison of chart plotters
These navigational tools are obviously the original “plotters”, or “chart plotters”. It’s still correct to refer to them by this name, but context is important, considering we are not discussing the omnipresent electronic chart plotters here.
Parallel Rule
- Traditionally used in North America.
- Easy to use for transfer of positions lines – running fix is a classic example.
- Very easy transfer of latitude and longitude from GPS to the chart.
- Ideally take advantage of the “Captain Field's improved” protractor-style version, and a sufficient length of 30 – 40 cm (12″ – 15″); cardinal and ordinal directions on the lower edge.
Douglas Protractor
- For small yachts without a nav table, or for cockpit navigation.
- Great for setting up position lines directly from the object on the chart. Simply put the centre over the object (protractor aligned N) and mark the angle on the chart. Draw position line from object through the mark.
- No need to slide or position the device to transpose the angle.
- 15 cm in size.
Breton Plotter
- Worldwide except North America.
- Excellent for laying off a course or bearing (i.e. plotting) or measuring a course or bearing.
Simply align on the course, turn the protractor to north (make sure it overlays a grid line) and read the direction; or vice versa. - The easiest to understand plotting tool for your crew and great for teaching purposes.
- Possibility to correct for magnetic variation and deviation all at once.
- Aim for a thin floppy one, and avoid the thicker brittle versions.
Navigation Protractor Triangle
- Common in continental Europe.
- Less prone to slipping in rough seas than walking with a Parallel Rule; one triangle sliding along the second one.
- There is a built-in scale of cardinal points (north, east, etc) and intercardinal (ordinal) points (e.g. between north and east there are NNE, NE, and ENE).
- Best 20 cm or larger, with handle, and ideally used in a combination of two.
- The supporting triangle does not need to have a protractor scale, and could also be replaced by a “plain” Parallel Rule.
Glossary
- Mercator projection: Most coastal nautical charts are constructed with this method. Angles are true and distances can be measured using the vertical scale.
Note that distortions of the central cylindrical projection are worse than that of the Mercator projection, yet many textbooks use illustrations central cylindrical projection to explain the Mercator projection.
The central cylindrical projection is the result of projecting points from the sphere onto a tangent cylinder along straight radial lines, as if from a light source placed at the Earth's center.
Among cylindrical projections, the Mercator projection is the unique projection which balances east–west stretching by a precisely corresponding north–south stretching, so that at every location the scale is locally uniform and angles are preserved.
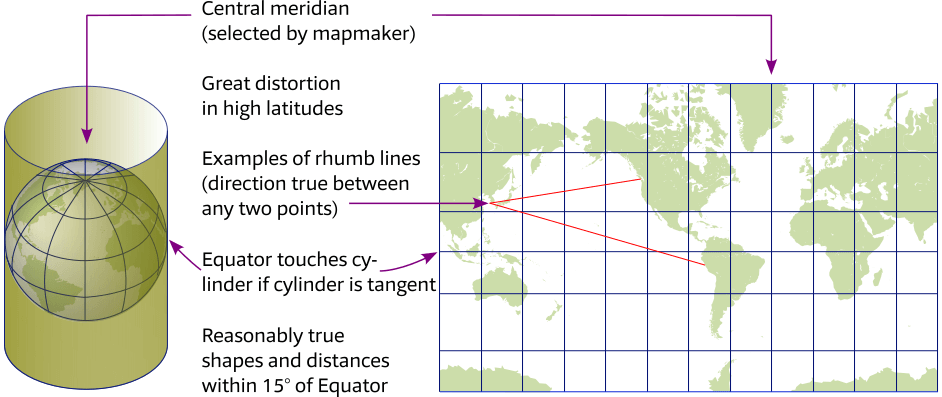
The Mercator projection is widely used for navigation charts, because any straight line is a line of constant true bearing that enables us to plot a straight-line course; the two red rhumb line examples cross every meridian at the same angle. Great circles (not shown) would appear as curves.
This projection is less practical for the small scale charts we use for ocean crossings because of distortions: areas farther away from the Equator appear disproportionately large. To avoid distortion in higher latitudes Secant and Oblique versions are used instead of the “Normal Tangent” projection that is shown in this figure.
- Stereographic projection: used for chart covering small areas. Like the Mercator projection we must use the vertical scale to measure distances.
- Gnomonic projection: used for vast areas. Great circles appear as straight lines on the chart.
- Great circle navigation: the shortest course on earth between two positions is a great circle; for circumnavigating and ocean crossings.
- Loxodrome: a line which makes the same angle with all meridians. Theoretically not the shortest route, but a handy straight line on a Mercator chart.
- Horizontal geodetic datum: defines the relationship between the ellipsoid adopted as the model of the earth's shape, and the earth itself.
Coordinates which refer to, for instance, WGS84 (World Geodetic System 1984) should be corrected before plotting them in a chart based on another horizontal datum. If your electronic ploter consistently disagrees with known positions by a constant amount and direction, then check that you have set it to display the correct horizontal datum. - Chart sounding datum: the tidal datum (a fictitious plane) to which soundings, heights, elevations and drying heights on a chart are referred.
- Vertical scale: distances in nautical miles (NM) or minutes (') should be measured at the same latitude on the vertical scale.
- Corrections: each chart is liable to corrections which are published by either a national body or the publisher of the nautical chart, always check for these updates.
See the next chapter…
- Course overview: goals and introduction
- Positions: latitude, longitude, nautical mile, scale, knots
- Nautical chart: coordinates, positions, courses, chart symbols, projections
- Compass: variation, deviation, true • magnetic • compass courses
- Plotting and piloting: LOPs, (running) fix, dead reckoning, leeway, CTS, CTW, COG
- Advanced piloting: double angle on the bow • four point • special angle fix, distance of horizon, dipping range, vertical sextant angle, radians, estimation of distances
- Astronomical origin of tides: diurnal, semi-diurnal, sysygy, spring, neap, axial tilt Earth, apsidal • nodal precession, declination Moon and Sun, elliptical orbits, lunar nodes
- Tides: tidal height prediction, chart datums, tidal curves, secondary ports
- Tidal streams and currents: diamonds, Course to Steer, Estimated Position
- Aids to navigation: buoys, leading lights, ranges, characteristics, visibility
- Lights and shapes: vessels sailing, anchoring, towing, fishing, NUC, RAM, dredging
Also you can download the exercises + answers PDF ![]()